Simple Harmonic Motion Ques 10
- For a simple pendulum, a graph is plotted between its Kinetic Energy (KE) and Potential Energy (PE) against its displacement $d$. Which one of the following represents these correctly? (graphs are schematic and not drawn to scale)
(2015 Main)
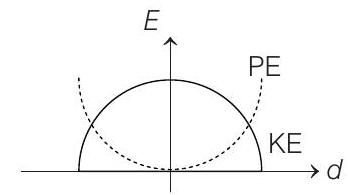
(a)
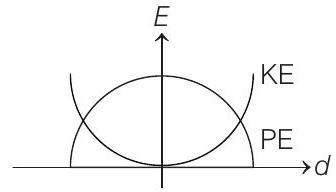
(b)
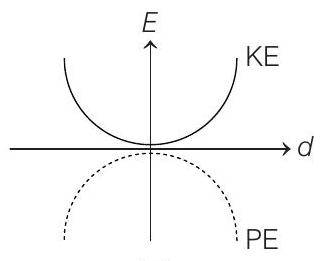
(c)
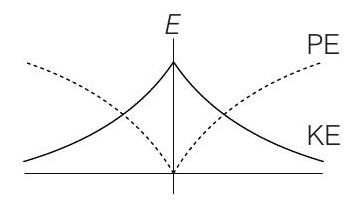
(d)
Show Answer
Answer:
Correct Answer: 10.(a)
Solution:
Formula:
- Taking minimum potential energy at mean position to be zero, the expression of $KE$ and $PE$ are
$KE=\frac{1}{2} m \omega^{2}\left(A^{2}-d^{2}\right)$ and $PE=\frac{1}{2} m \omega^{2} d^{2}$
Both graphs are parabola. At $d=0$, the mean position,
$PE=0$ and $KE=\frac{1}{2} m \omega^{2} A^{2}=$ maximum
At $d= \pm A$, the extreme positions,
$KE=0$ and $PE=\frac{1}{2} m \omega^{2} A^{2}=$ maximum
Therefore, the correct graph is (a).