sathee Ask SATHEE

Welcome to SATHEE !
Select from 'Menu' to explore our services, or ask SATHEE to get started. Let's embark on this journey of growth together! 🌐📚🚀🎓

I'm relatively new and can sometimes make mistakes.
If you notice any error, such as an incorrect solution, please use the thumbs down icon to aid my learning.
To begin your journey now, click on

Please select your preferred language

JEE PYQ: Motion In One Dimension Question 1

Question 1 - 2021 (16 Mar Shift 1)

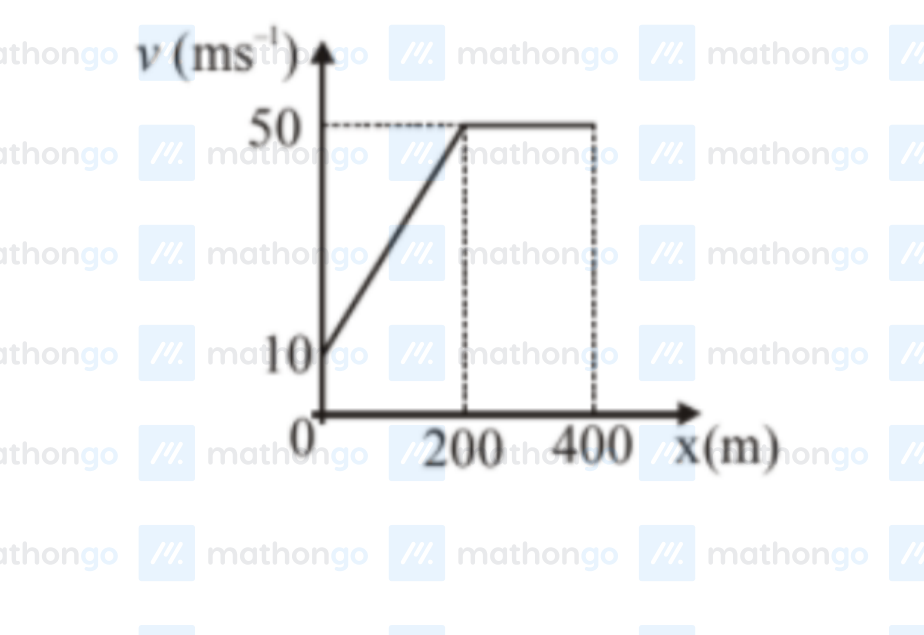
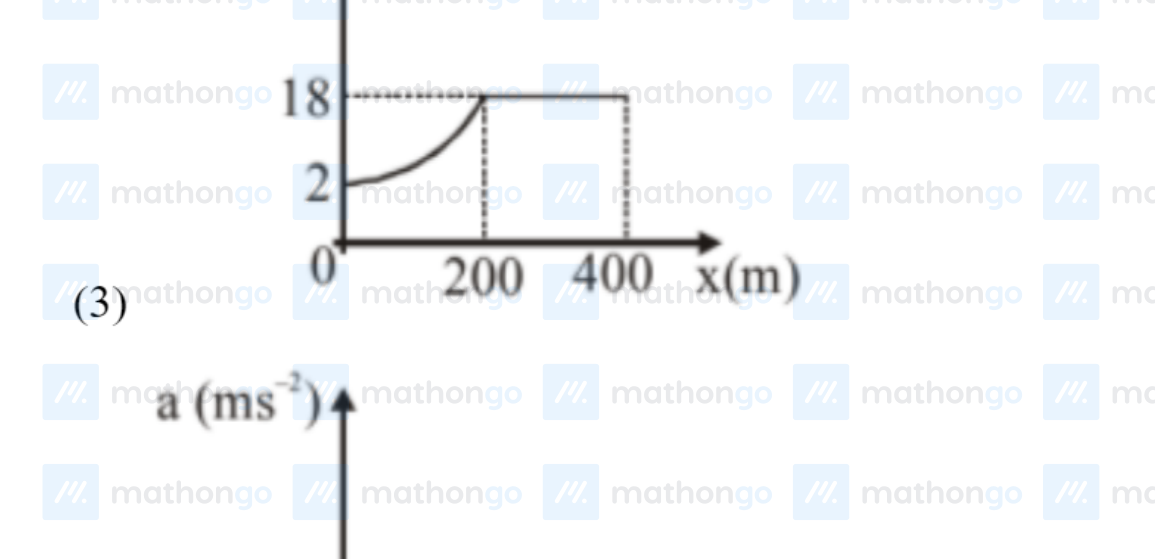
The velocity-displacement graph describing the motion of a bicycle is shown in the figure.

v-x graph with v (ms$^{-1}$) on y-axis and x (m) on x-axis. v increases linearly from 10 at x=0 to 50 at x=200, then remains constant at 50 for x > 200

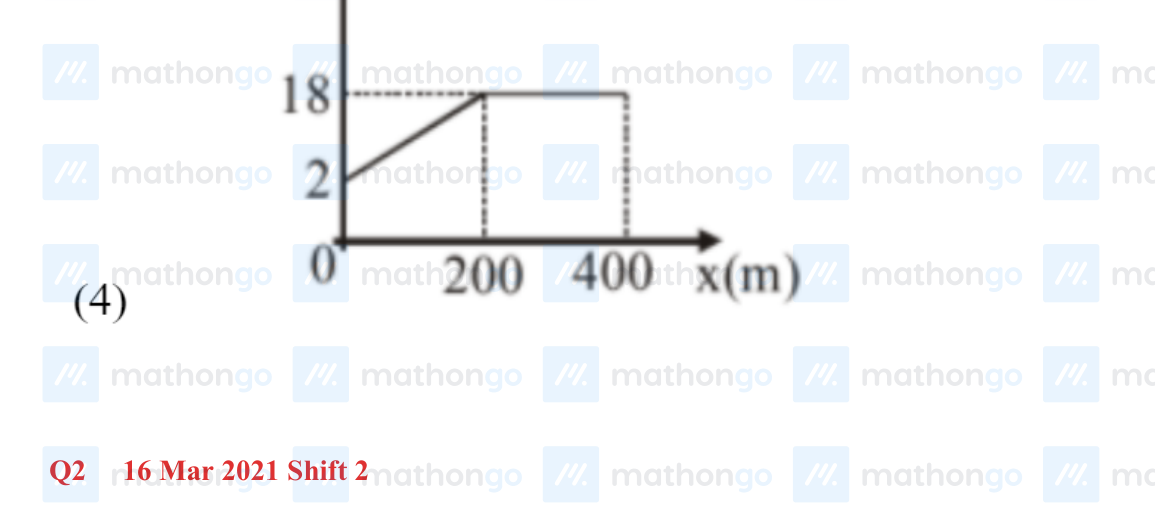
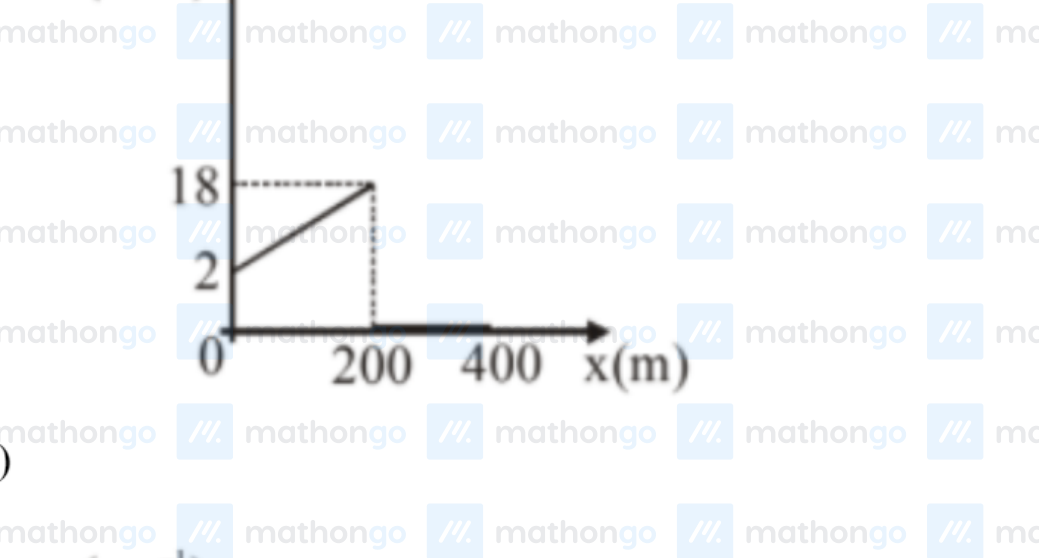
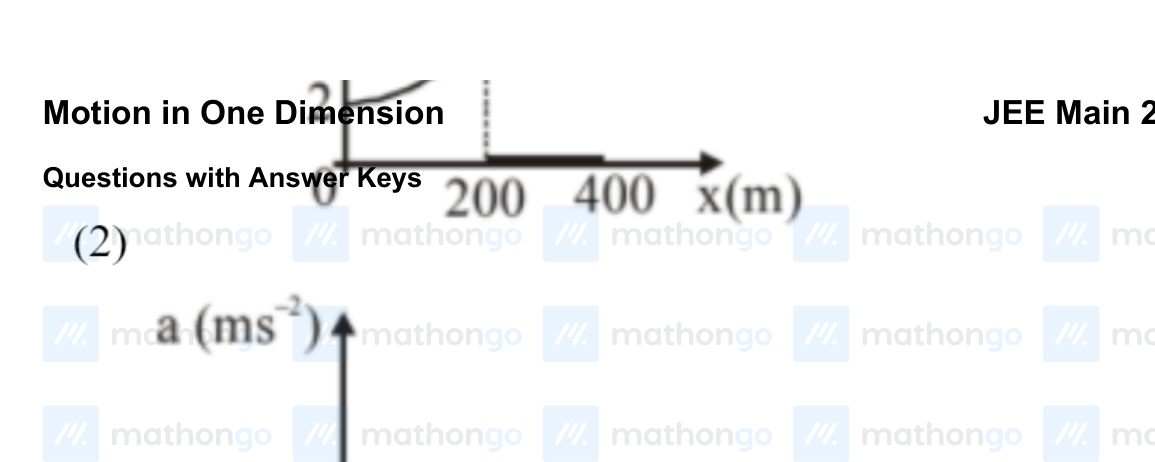
The acceleration-displacement graph of the bicycle’s motion is best described by:

(1) a vs x graph — a increases linearly from 2 to 18 for 0 < x < 200, then drops to 0 for x > 200

(2) a vs x graph — a increases linearly from 2 to 18 for 0 < x < 200, then drops to 0 for x > 200, with a curve at transition

(3) a vs x graph — a is constant at 18 for 0 < x < 200, then drops to 0

(4) a vs x graph — a is constant at 2 for 0 < x < 200, then drops to 0

Show Answer

Answer: (1)


Learning Progress: Step 1 of 32 in this series